The way that I select which risk category a drug should be in based on the training data I have is called Linear Discriminant Analysis (LDA). I've made a little example of how it works using MATLAB (however, this code also works perfectly on the wonderful, and free, Octave).
You can download my MATLAB/Octave script and try it out yourself (it takes one input, a number). Below, I'll go through it step by step.
function LDA(point)

%% group 1: mean 10, sd 2
%% group 2: mean 3, sd 1
%% group 3: mean 5, sd 0.5

group_1 = 10 + 2*randn(10,1);
group_2 = 3 + randn(10,1);
group_3 = 5 + 0.5*randn(10,1);
These first few lines create a set of training data, by making random numbers based on three normal distributions with different means and standard deviations. In real life, you wouldn't know how your data were generated or what distribution they came from.
%% plot all of the training data
hold off
plot(group_1, zeros(10,1),'o')
hold on
plot(group_2, zeros(10,1),'+')
plot(group_3, zeros(10,1),'.')
Now for visualisation we plot the training data, delineating the different groups by differently shaped markers.

%% find the likelihood of the point given the group
p_x1 = normpdf(point,mean(group_1),std(group_1));
p_x2 = normpdf(point,mean(group_2),std(group_2));
p_x3 = normpdf(point,mean(group_3),std(group_3));
The first thing we need to find is the probability that this point (the input number, in this case 9.5114) would exist given the group that it's a member of, i.e.  . In LDA, you assume that the points within each group are normally distributed, so in MATLAB/Octave there's a useful function called normpdf that calculates the probability of a point given the mean and standard deviation of the distribution.
%% find the probability of the group given the point using Bayes' rule
p_i1 = (p_x1*(1/3))/((p_x1+p_x2+p_x3)*1/3);
p_i2 = (p_x2*(1/3))/((p_x1+p_x2+p_x3)*1/3);
p_i3 = (p_x3*(1/3))/((p_x1+p_x2+p_x3)*1/3);
Bayes' rule is that 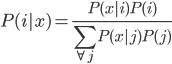 .
.
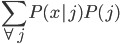 is actually the same for all groups, so we can ignore it. Because there are three groups of ten items, we know that
  is always
  . This means that we could have simplified these calculations by just comparing the likelihoods ().
%% which one has the maximum probability?
[a b] = max([p_i1,p_i2,p_i3]);

if b==1
    dotshape = 'o';
elseif b==2
    dotshape = '+';
else
    dotshape = '.';
end

%% plot to see if we're right
plot(point,0,strcat(dotshape,'r'))
hold off

end
We end by picking the group that has the highest probability, i.e. the highest
 , and then plot that on the graph.

If you have more than one set of data points (i.e. if you are classifying based on two features), you can assume that the covariances in different groups are all equal, which simplifies the calculations for that system.